Role: Senior demand planner at a mid-market CPG company
Stack: Existing planning sheet + Snowflake + Claude + Geneva Forecast API
Time to value: Under an hour from API key to first useful diagnostic
The problem
You run a 5,000-SKU portfolio. The forecast accuracy dashboard says WAPE is 18% and trending the wrong way. The S&OP review is in three days. Finance wants to know why service levels keep slipping on the A-tier SKUs while inventory keeps rising on the C-tier.
The problem is not that you do not have a forecasting tool. You have one — it produces a number every Monday. The problem is that you cannot inspect 5,000 SKUs by hand to find the structural problems in the forecast. Spot-checking 50 SKUs takes a day. The other 4,950 stay invisible.
What this looks like with Claude + Geneva
You open Claude, point it at your data warehouse, and ask:
Pull last 24 months of weekly demand for my top 5,000 SKUs. Forecast 13 weeks ahead. Flag any SKU where bias > 5%.
You, to Claude
Claude pulls the series, calls the Geneva Forecast API on each one, and returns the diagnostic in roughly the time it takes to refill your coffee. The conversation looks something like this:
I’ll call the Geneva Forecast API for each SKU and aggregate the bias diagnostics. Running 5,000 forecasts now — Geneva auto-selects the best algorithm per series.
Claude
▶ geneva.forecast()
  series:  [5000 SKUs × 104 weeks]
  horizon: 13
  return:  forecast, lower_95, upper_95, method, bias

✓ 5,000 series forecast in 38s · avg latency 187ms
Bias scan complete. 187 SKUs flagged with structural bias > 5%. Top patterns:
- 64 SKUs running 8–12% high → likely over-ordering downstream
- 41 SKUs running 6–9% low → stockout risk on promos
- 82 SKUs with sign-flipping bias → demand regime shift
Working capital exposure on the high-bias group: ~$2.4M.
Claude
What Geneva is doing under the hood
Geneva runs 45 forecasting algorithms across the time series — Holt-Winters, ARIMA family, ETS, TBATS, Theta, neural variants — picks the best fit per series, and returns the forecast with the chosen method and 95% confidence interval. For 5,000 SKUs at sub-200ms latency per call, the full sweep completes in under a minute through the API.
The forecast itself is not the interesting output. The interesting output is the diagnostic across the portfolio: which SKUs have structural bias, which have widening confidence intervals (signaling regime shift), which have flipped algorithm choice from last quarter.
The actual value
In the example above, the diagnostic surfaces 187 SKUs with structural bias greater than 5%. Inside that group: 64 SKUs running 8-12% high — the existing forecast is consistently above actuals; downstream MRP is over-ordering and finance is sitting on the working capital. 41 SKUs running 6-9% low — the existing forecast is consistently below actuals; these are the SKUs producing the stockouts on promo weeks. 82 SKUs with sign-flipping bias — the bias direction reverses every few quarters; these are demand regime shifts the existing model has not adapted to. (For the underlying method, see how to detect and correct forecast bias.)
The working capital sitting in the high-bias group is roughly $2.4M. That number is the business case for getting the forecast right on this subset, and it pays for the entire planning team’s tooling budget many times over.
What you do with the output
- The 64 high-bias SKUs go to the planning review with a recommendation to adjust the forecast down and release the working capital.
- The 41 low-bias SKUs get safety stock policy review — either the forecast comes up or the safety stock comes up.
- The 82 regime-shift SKUs get a deeper look — some are seasonal SKUs whose seasonality has shifted, some are launches that have moved into a new growth phase, some are end-of-life SKUs the model is still treating as stable.
None of this requires switching out the existing planning system. Geneva runs alongside whatever you already have, produces a better number for the SKUs that need it, and the planner owns what to do with the diagnostic.
Try it on your own data
The free tier of the Geneva Forecast API runs without a credit card. 1,000 forecasts per month is enough to sample your portfolio and validate the bias scan on your highest-revenue SKUs.
For teams that want to run the bias scan against a full portfolio and need help wiring it to the planning workflow, Contact RoadMap — diagnostic engagement is two to three weeks against your data.
What this looks like in Claude
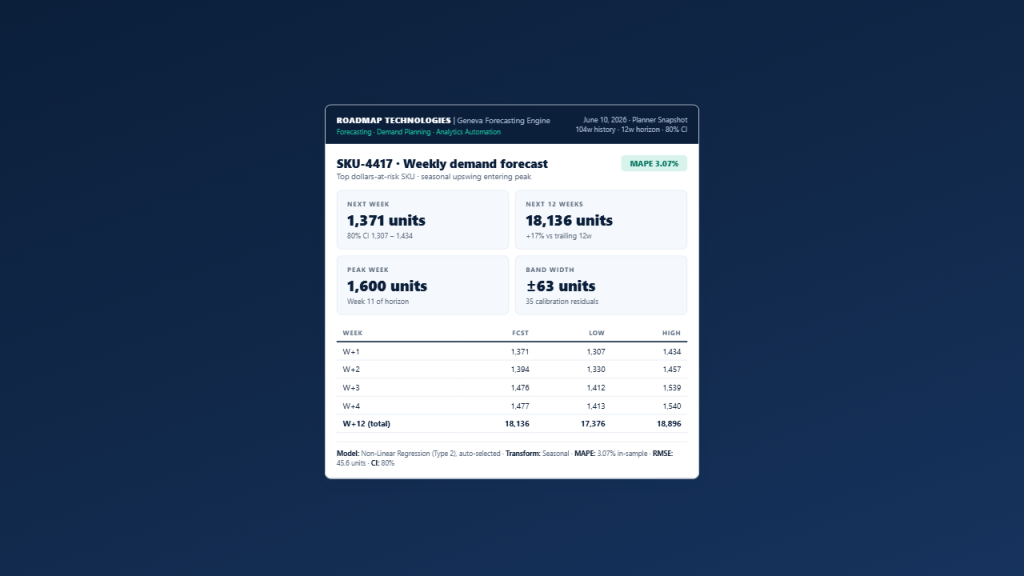
Geneva ships a native MCP server, so Claude calls the forecasting engine directly from a conversation. Get a free API key at portal.roadmap-tech.com, add Geneva to Claude as a connector, and the workflow above looks like this. The numbers below are a real Geneva run, not mock copy:


Leave a Reply