Role: Product engineer at a usage-based SaaS company
Stack: Node.js + Postgres + Claude + Geneva Forecast API
Time to value: One afternoon from API key to widget shipped
The problem
Your product is usage-based. Customers consume credits, compute, API calls, storage — pick your metric. The customers who care most about cost ask the same question every renewal cycle: What am I projected to use next month? The answer drives plan upgrades, budget conversations, and renewal expansion.
The naive answer is “average your last 30 days.” That answer is wrong for any customer with growth, seasonality, or a recent change in usage pattern. The right answer is a forecast — but building a forecasting capability for a feature most engineers think of as “a widget” is overkill.
The fix is to embed a forecasting API as the engine and own the layer above it. Geneva handles the model selection, parameter tuning, and confidence intervals. You handle the integration, the cache, and the UI.
What this looks like with Claude
You open Claude, hand it the spec, and ask:
Add a ‘projected usage next 30 days’ widget to our dashboard, forecasted from each user’s last 90 days of activity. Use Geneva.
You, to Claude
Claude writes the server-side endpoint, the cache layer, and the frontend widget. The interesting part is how short the code is.
// api/projected-usage.ts
import { geneva } from "@roadmap-tech/geneva"

export async function projectedUsage(userId) {
  const series = await db.usage.daily(userId, 90)
  const f = await geneva.forecast({
    series,
    horizon: 30,
    freq: "D",
    return: ["forecast", "lower_95", "upper_95"]
  })
  return {
    projected: sum(f.forecast),
    band: [sum(f.lower_95), sum(f.upper_95)]
  }
}
The widget that ships to the customer dashboard shows the projected total, the 95% confidence band, and an optional plan-upgrade trigger when projected usage crosses the plan ceiling. Example:
Projected usage · next 30 days
Widget preview
12,847 credits · 95% range: 11,200 – 14,300
▲ on track for plan upgrade
What Geneva is doing that you do not have to
The reason the integration is fifty lines and not five hundred is that Geneva handles the parts that are tedious to build in-house:
- Algorithm selection. Forty-five forecasting methods evaluated per series, best fit chosen by the engine.
- Parameter tuning. Each algorithm is parameter-tuned per series.
- Seasonality detection. Daily, weekly, monthly seasonalities detected automatically.
- Confidence intervals. Returned as part of the response.
- Edge cases. Short series, sparse series, constant series, regime shifts — the engine handles them and tells you which method it used.
This is the value of the embed pattern. The forecasting engine is hard to build well; the integration around it is straightforward.
The widget customers actually see
The frontend renders the forecast as a single number, the confidence band, a small sparkline, and an optional plan-upgrade trigger when the projected usage crosses the threshold. The example above shows a user projected at 12,847 credits with a 95% range of 11,200 to 14,300. The “on track for plan upgrade” indicator fires when the projected usage exceeds the current plan ceiling. That trigger is a leading indicator for plan upgrades — caught a month early, it gives customer success time to position the upgrade as a win rather than a surprise overage.
The deployment shape
- Endpoint:
/api/projected-usage/:userIdreturns the forecast. - Cache: Redis or in-process, keyed by
(userId, today). TTL 24 hours. - Refresh: Nightly batch job warms the cache for every active user, so the first request of the day is already cached.
- Cost: With caching, one Geneva call per active user per day. For 10,000 daily active users on the paid tier, this is a small fraction of the monthly API budget.
The product surface this opens
- User dashboard widget — table stakes, what customers explicitly ask for.
- In-app upgrade prompts — fired when projected usage crosses plan limits. Higher conversion than time-based prompts because they are tied to real usage signal.
- Customer success leading indicator — surfaced in the internal CS tool when a customer’s projected usage drops below a threshold (churn signal) or above a threshold (expansion signal).
Same forecast endpoint, three product surfaces, all driven by the same Geneva call.
What this looks like in Claude
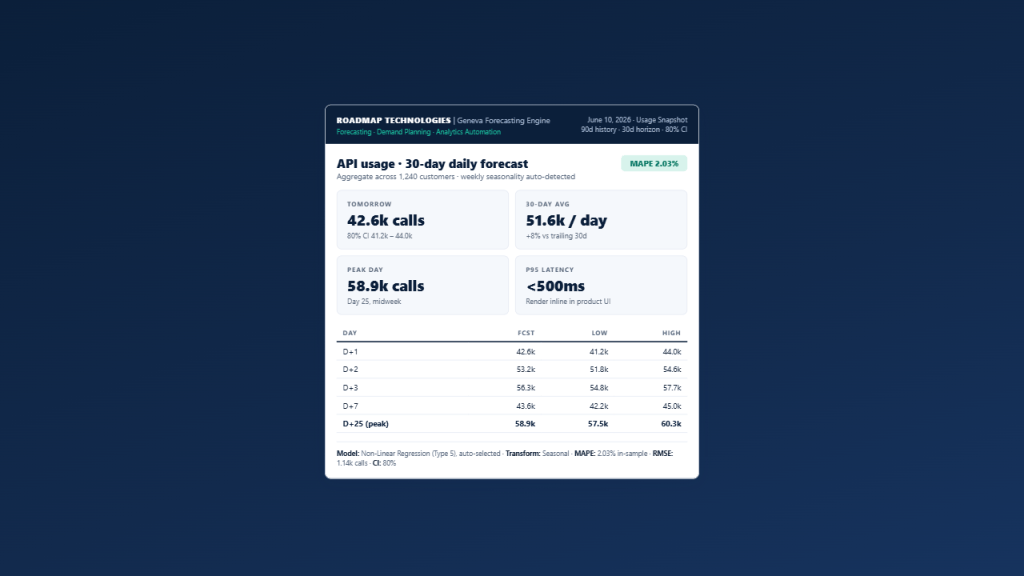
Geneva ships a native MCP server, so Claude calls the forecasting engine directly from a conversation. Get a free API key at portal.roadmap-tech.com, add Geneva to Claude as a connector, and the workflow above looks like this. The numbers below are a real Geneva run, not mock copy:
Try it on your own data
The free tier is 1,000 forecasts per month, no credit card. That is enough to wire the integration, test it against your top 30 customers, and validate the projection accuracy before committing to a paid tier.
For engineering teams that want a working integration reference plus help sizing the production deployment, Contact RoadMap.


Leave a Reply