Role: Senior FP&A analyst at a SaaS company
Stack: Salesforce + Snowflake + Google Sheets + Claude + Geneva Forecast API
Time to value: Under 30 minutes for a quarterly variance read
The problem
Every quarter, the revenue forecast goes through two reconciliations. Sales presents the pipeline-based number — bottom-up, deal-by-deal, conversion-rate-weighted. Finance produces a second number — top-down, pattern-based, anchored on historical growth and seasonality. They almost never match.
The hard work is figuring out where the gap is. Is sales optimistic on Services because they have a few large deals leaning forward? Is the pattern forecast missing a structural acceleration in Marketplace? You cannot tell from the totals — you need product-line resolution and a defensible second opinion on each line.
What this looks like with Claude + Geneva
You drop a CSV of last 16 quarters of revenue by product line into Claude, hand it the current pipeline forecast, and ask:
Here’s our quarterly revenue by product line, last 16 quarters. Forecast Q3 and Q4 using Geneva. Compare to current pipeline-based forecast. Where are we exposed?
You, to Claude
Running Geneva on each product line, then differencing against the pipeline forecast you uploaded.
Claude
▶ geneva.forecast()  · 4 product lines · horizon=2 quarters
  Core SaaS    : ETS(M,A,M) selected   · MAPE 4.1%
  Services     : ARIMA(2,1,2) selected · MAPE 7.8%
Marketplace : TBATS selected · MAPE 9.2%| Product Line | Pipeline ($M) | Geneva ($M) | Δ | Read |
|---|---|---|---|---|
| Core SaaS | 42.0 | 41.6 | −0.4 | aligned |
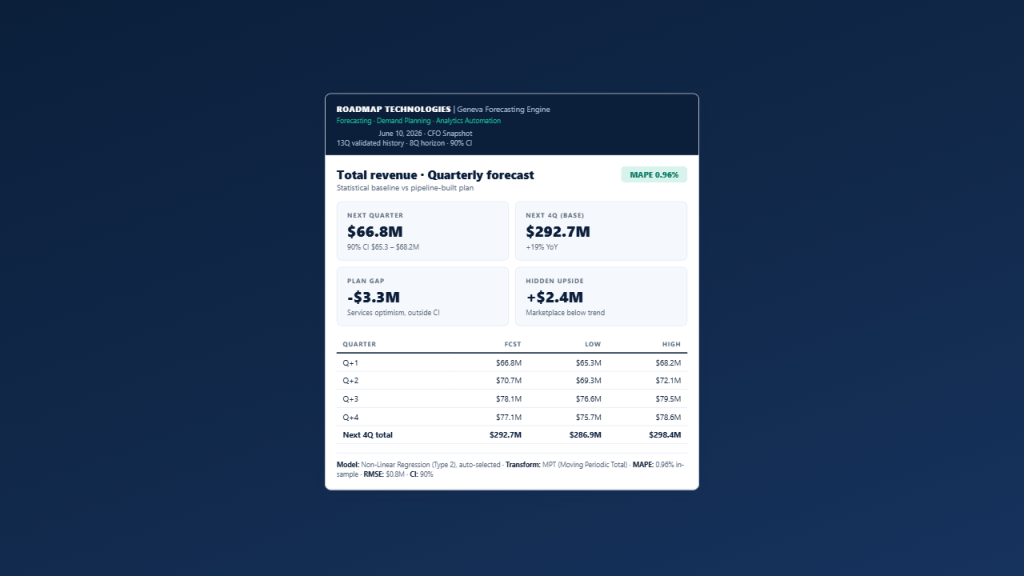
| Services | 18.5 | 15.2 | −3.3 | pipeline optimistic |
| Marketplace | 9.0 | 11.4 | +2.4 | upside unbooked |
| Total | 69.5 | 68.2 | −1.3 | — |
Read: Services pipeline is ~22% above the historical-pattern forecast. Two paths: either pipeline conversion will exceed normal rates, or the forecast is optimistic. Marketplace looks like unbooked upside — worth pulling into the forecast review.
Claude
What Geneva produces
Geneva picks the best-fit algorithm per product line and reports it. In the example above, Core SaaS uses ETS with multiplicative trend and multiplicative seasonality (MAPE 4.1% against held-out history); Services uses ARIMA(2,1,2) (MAPE 7.8%) for the lumpier business with longer deal cycles; Marketplace uses TBATS (MAPE 9.2%) to handle complex seasonality and emerging growth.
The fact that Geneva picked a different algorithm for each product line is the value. A single-method forecast — the kind most planning tools apply uniformly — would handle one of these well and miss on the others.
The reconciliation that matters
The total gap is small — $1.3M on a $69.5M quarter. That number alone would suggest the two forecasts are basically aligned. The total is wrong. The interesting story is inside the lines:
Services pipeline is running 22% above the pattern-based forecast. Two readings: either pipeline conversion will exceed normal rates this quarter, or the pipeline forecast is leaning into deals that historically slip. The CFO conversation is what changed in Services to justify a 22% premium over pattern.
Marketplace pattern forecast is 27% above pipeline. Pipeline cannot see Marketplace upside because most of it is self-serve revenue that does not flow through Salesforce. The pattern forecast catches it; pipeline does not. Worth pulling into the formal forecast.
Core SaaS aligns — both methods agree within $400K. That is the boring good news.
The total looks aligned because Services optimism roughly cancels Marketplace blindness. If you reported only the total, the board would think the forecast is in good shape. It is not — it is two large errors that happen to cancel.
What you do with the output
- Bring Services pipeline review. Walk through the deals contributing the $3.3M premium. Either adjust the pipeline number or get conviction on the premium.
- Surface Marketplace upside formally. If self-serve growth is structurally above the pipeline forecast, it belongs in the official number. The pattern forecast is the evidence.
- Lock in Core SaaS. Both methods agree. No further work needed on this line for Q3.
Try it on your own quarter
The free tier runs without a credit card. Drop in your last 16 quarters of revenue by product line, ask Claude to forecast and compare against your pipeline, see what the gap analysis surfaces.
For finance teams that want a structured forecast reconciliation as a recurring monthly close artifact, Contact RoadMap — we wire this into the close calendar in two to three weeks.
What this looks like in Claude
Geneva ships a native MCP server, so Claude calls the forecasting engine directly from a conversation. Get a free API key at portal.roadmap-tech.com, add Geneva to Claude as a connector, and the workflow above looks like this. The numbers below are a real Geneva run, not mock copy:


Leave a Reply