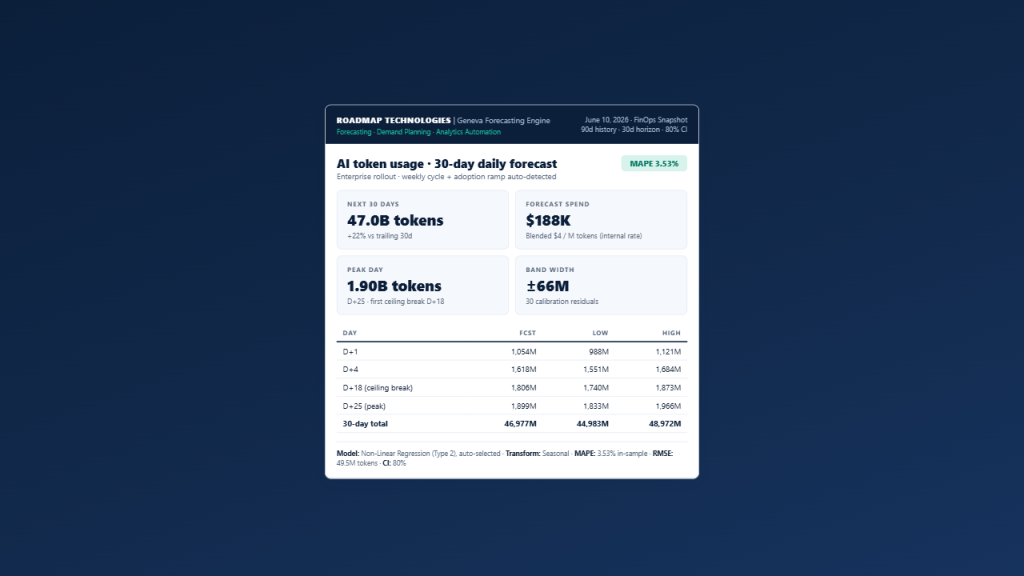
Every business unit is adding copilots, agents, and AI-assisted workflows. Token consumption is now one of the fastest-growing line items in the technology budget, and it does not move smoothly: weekly usage cycles, adoption ramps, and step changes when a new team onboards. Finance wants a spend forecast. Platform wants to know when usage crosses the rate-limit ceiling. Spreadsheets handle neither.
The problem
An enterprise platform team is six months into an AI rollout. Daily token usage has nearly doubled, a new support organization just onboarded and added a visible step to the curve, and the CFO wants a defensible number for next quarter. Naive trendlines miss the weekly cycle (weekend usage drops by a third) and overreact to the onboarding step. The team needs a forecast that separates structural growth from noise, with confidence intervals that can back a budget commitment.
What this looks like in Claude
Geneva ships a native MCP server, so Claude calls the forecasting engine directly from a conversation. Get a free API key at portal.roadmap-tech.com, add Geneva to Claude as a connector, and the workflow looks like this. The numbers below are a real Geneva run, not mock copy:
What Geneva is doing under the hood
Geneva backtests its model library against the 90-day history and auto-selects the best fit, here a non-linear regression with a seasonal transform that captures both the weekly usage cycle and the accelerating adoption trend. Every forecast ships with 80% confidence intervals calibrated on actual residuals, which is what turns “usage is growing” into “we cross the ceiling on day 18, with this much uncertainty.”
The actual value
- Budget you can defend: a spend forecast with intervals, not a trendline. Finance gets $188K ± a quantified band, refreshed daily.
- Capacity before throttling: the ceiling-crossing date arrives two-plus weeks in advance, time to negotiate rate limits or stagger workloads instead of firefighting.
- Chargeback per business unit: run the same call per BU series and allocate forecast spend to the teams driving it.
- Renewal leverage: walking into a vendor negotiation with a calibrated 12-month consumption forecast beats guessing a commit tier.
Try it on your own data
Export daily token usage from your platform dashboard, point Claude + Geneva at it, and ask the same question. First forecast in under five minutes.
For teams that want per-BU chargeback wired into the FinOps workflow, Contact RoadMap. A diagnostic engagement is two to three weeks against your data.
 SalesForecast - The Forecasting API That Powers Your AI
Leave a comment